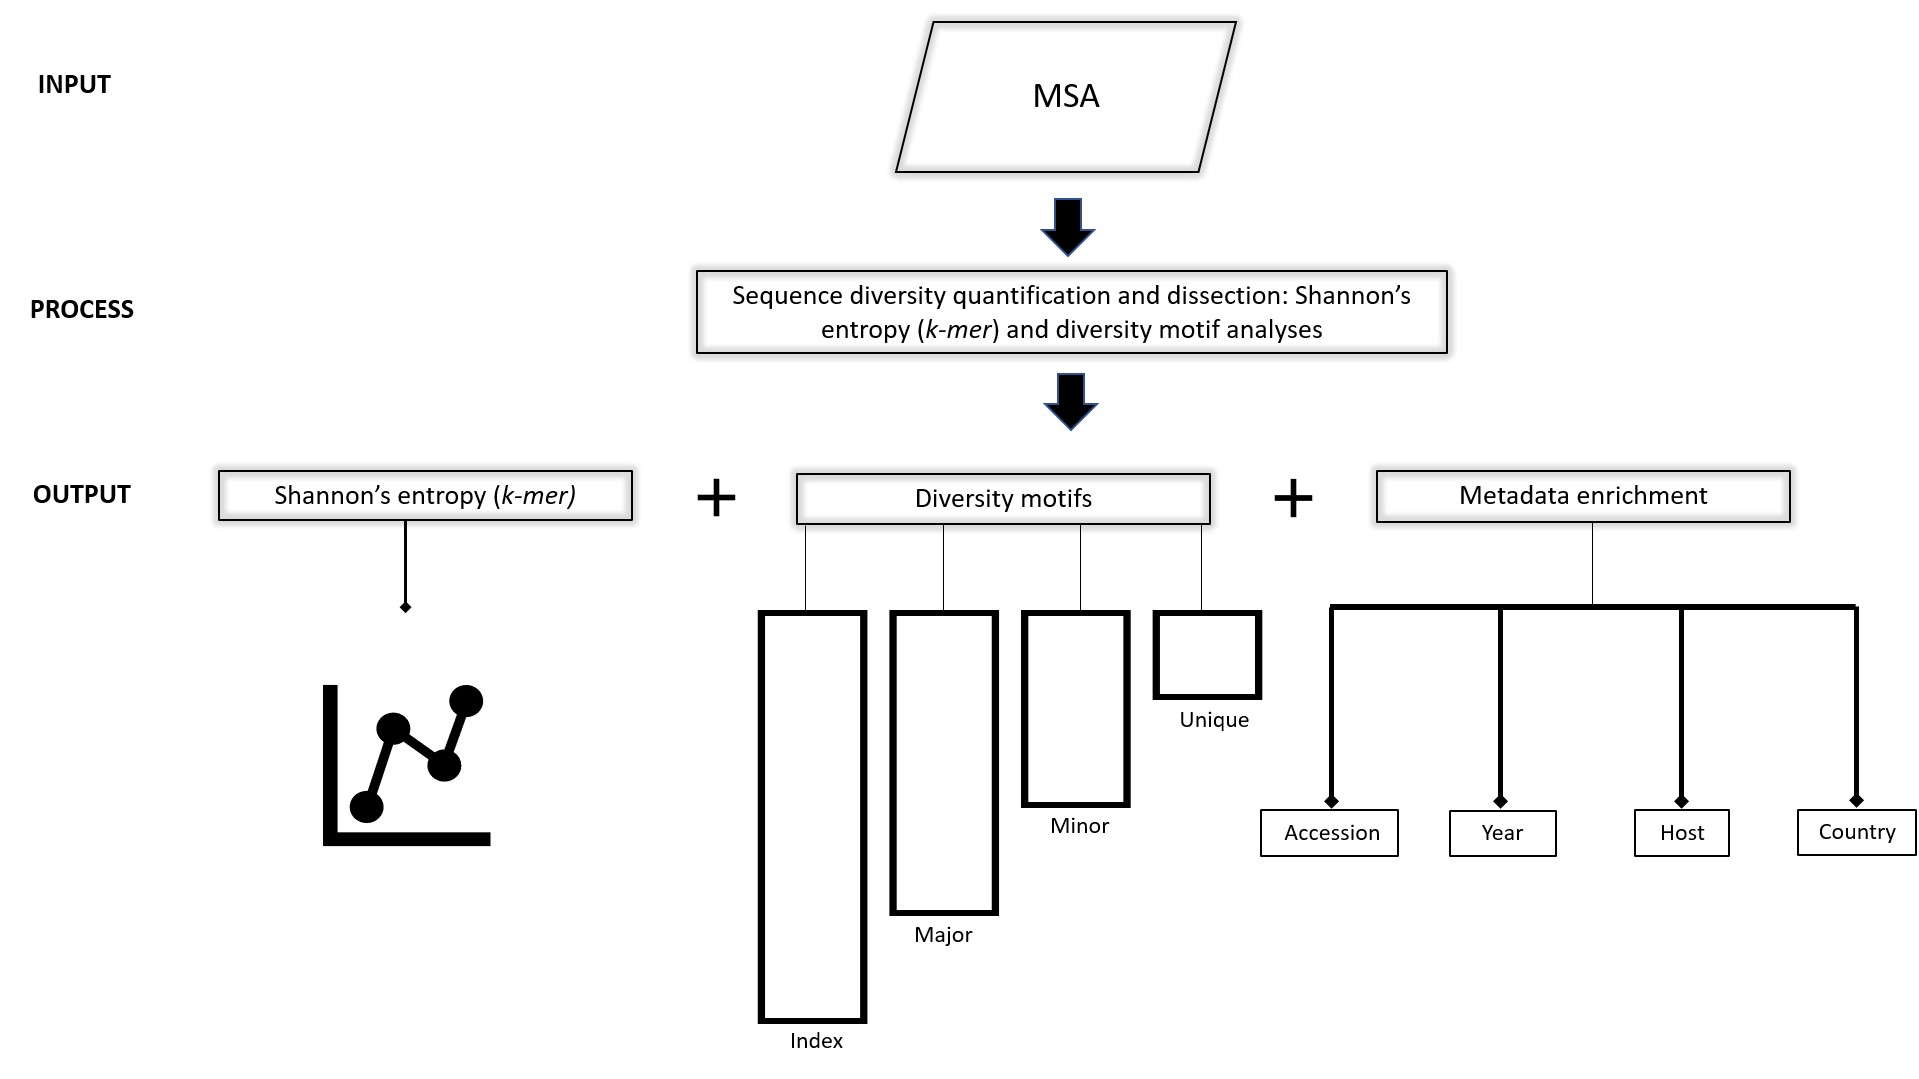
Figure 2. Workflow schema. Input: Viral protein sequences, typically obtained from publicly available databases (NCBI virus and GISAID, among others), aligned and submitted to DiMA in aligned FASTA (.afa) format. Process: DiMA provides a quantitative measure of sequence diversity by use of Shannon’s entropy, applied via a user-defined k-mer sliding window. Further, the entropy value is corrected for sample size bias by applying a statistical adjustment (Lipinski’s rule). Additionally, DiMA further interrogates the diversity by dissecting the entropy value at each k-mer position to various distinct k-mer sequences that are classified into diversity motifs (index, major, minor and unique; see Section 3 for the definition of the diversity motifs) based on their incidence. Output: The entropy values, diversity motifs, and each of the k-mer corresponding metadata is plotted to provide a panoramic overview of the protein sequence diversity.
2.1. Entropy algorithm

2.2. Performance testing of DiMA
DiMA has been extensively tested with 18 protein datasets from six viral species. External validation of our tool has been performed by three individuals, with a total of 36 protein datasets, originating from three viral species.
2.3. Performance testing of Sample size bias correction
As it was explained in Figure 3, entropy is corrected for sample size bias. Two tests by use of DNA polymerase (Pol) protein of Human immunodeficiency virus type 1 (HIV-1) group M, with curated alignment, downloaded from the Los Alamos HIV sequence database were done the difference between uncorrected (baseline) and corrected entropy values. The difference (deviation) of these values were evaluated over 100 iterations. Experiment details and conclusions are listed below.
1- Mean entropy value for all positions of the protein

Conclusions:
There was very little variation between the protein-wide mean corrected entropy value over the multiple runs - a maximum difference of ~0.008 was observed.
If we take the average of the protein-wide mean corrected entropy values over the 100 iterations and compare that with the average for the baseline, the difference was ~0.01.
2- Entropy value across four different conservation levels (extremely diverse, ED with index incidence of 1%; highly diverse, HD with index incidence of 15%; moderately diverse, MD with index incidence of 50%; highly conserved, HC with index incidence of 98%)

Conclusions:
The difference between the baseline and corrected entropy is affected by the inherent diversity of the sequences at the given position. The higher the diversity, the higher the difference between the two entropy values, with as high as approximately a difference of 2 entropy units for the extremely diverse position.
The baseline entropy value appears to be generally an over-estimate relative to the corrected entropy, which can be a reflection of better data distribution achieved through the resampling approach for the corrected entropy.
3- Entropy values for 100 positions of the protein

Conclusions:
Supportive findings were observed with the first and second tests.